Documentation Index
Fetch the complete documentation index at: https://gateway.sanctum.so/docs/llms.txt
Use this file to discover all available pages before exploring further.

- Transactions Sent: The number of transactions being sent from your project
- Landing Rate: The proportion of landed transactions relative to the total number of transactions sent.
- Priority Fees: The amount of priority fees consumed by transactions
- Fee Breakdown: The time series chart of the distribution of fees
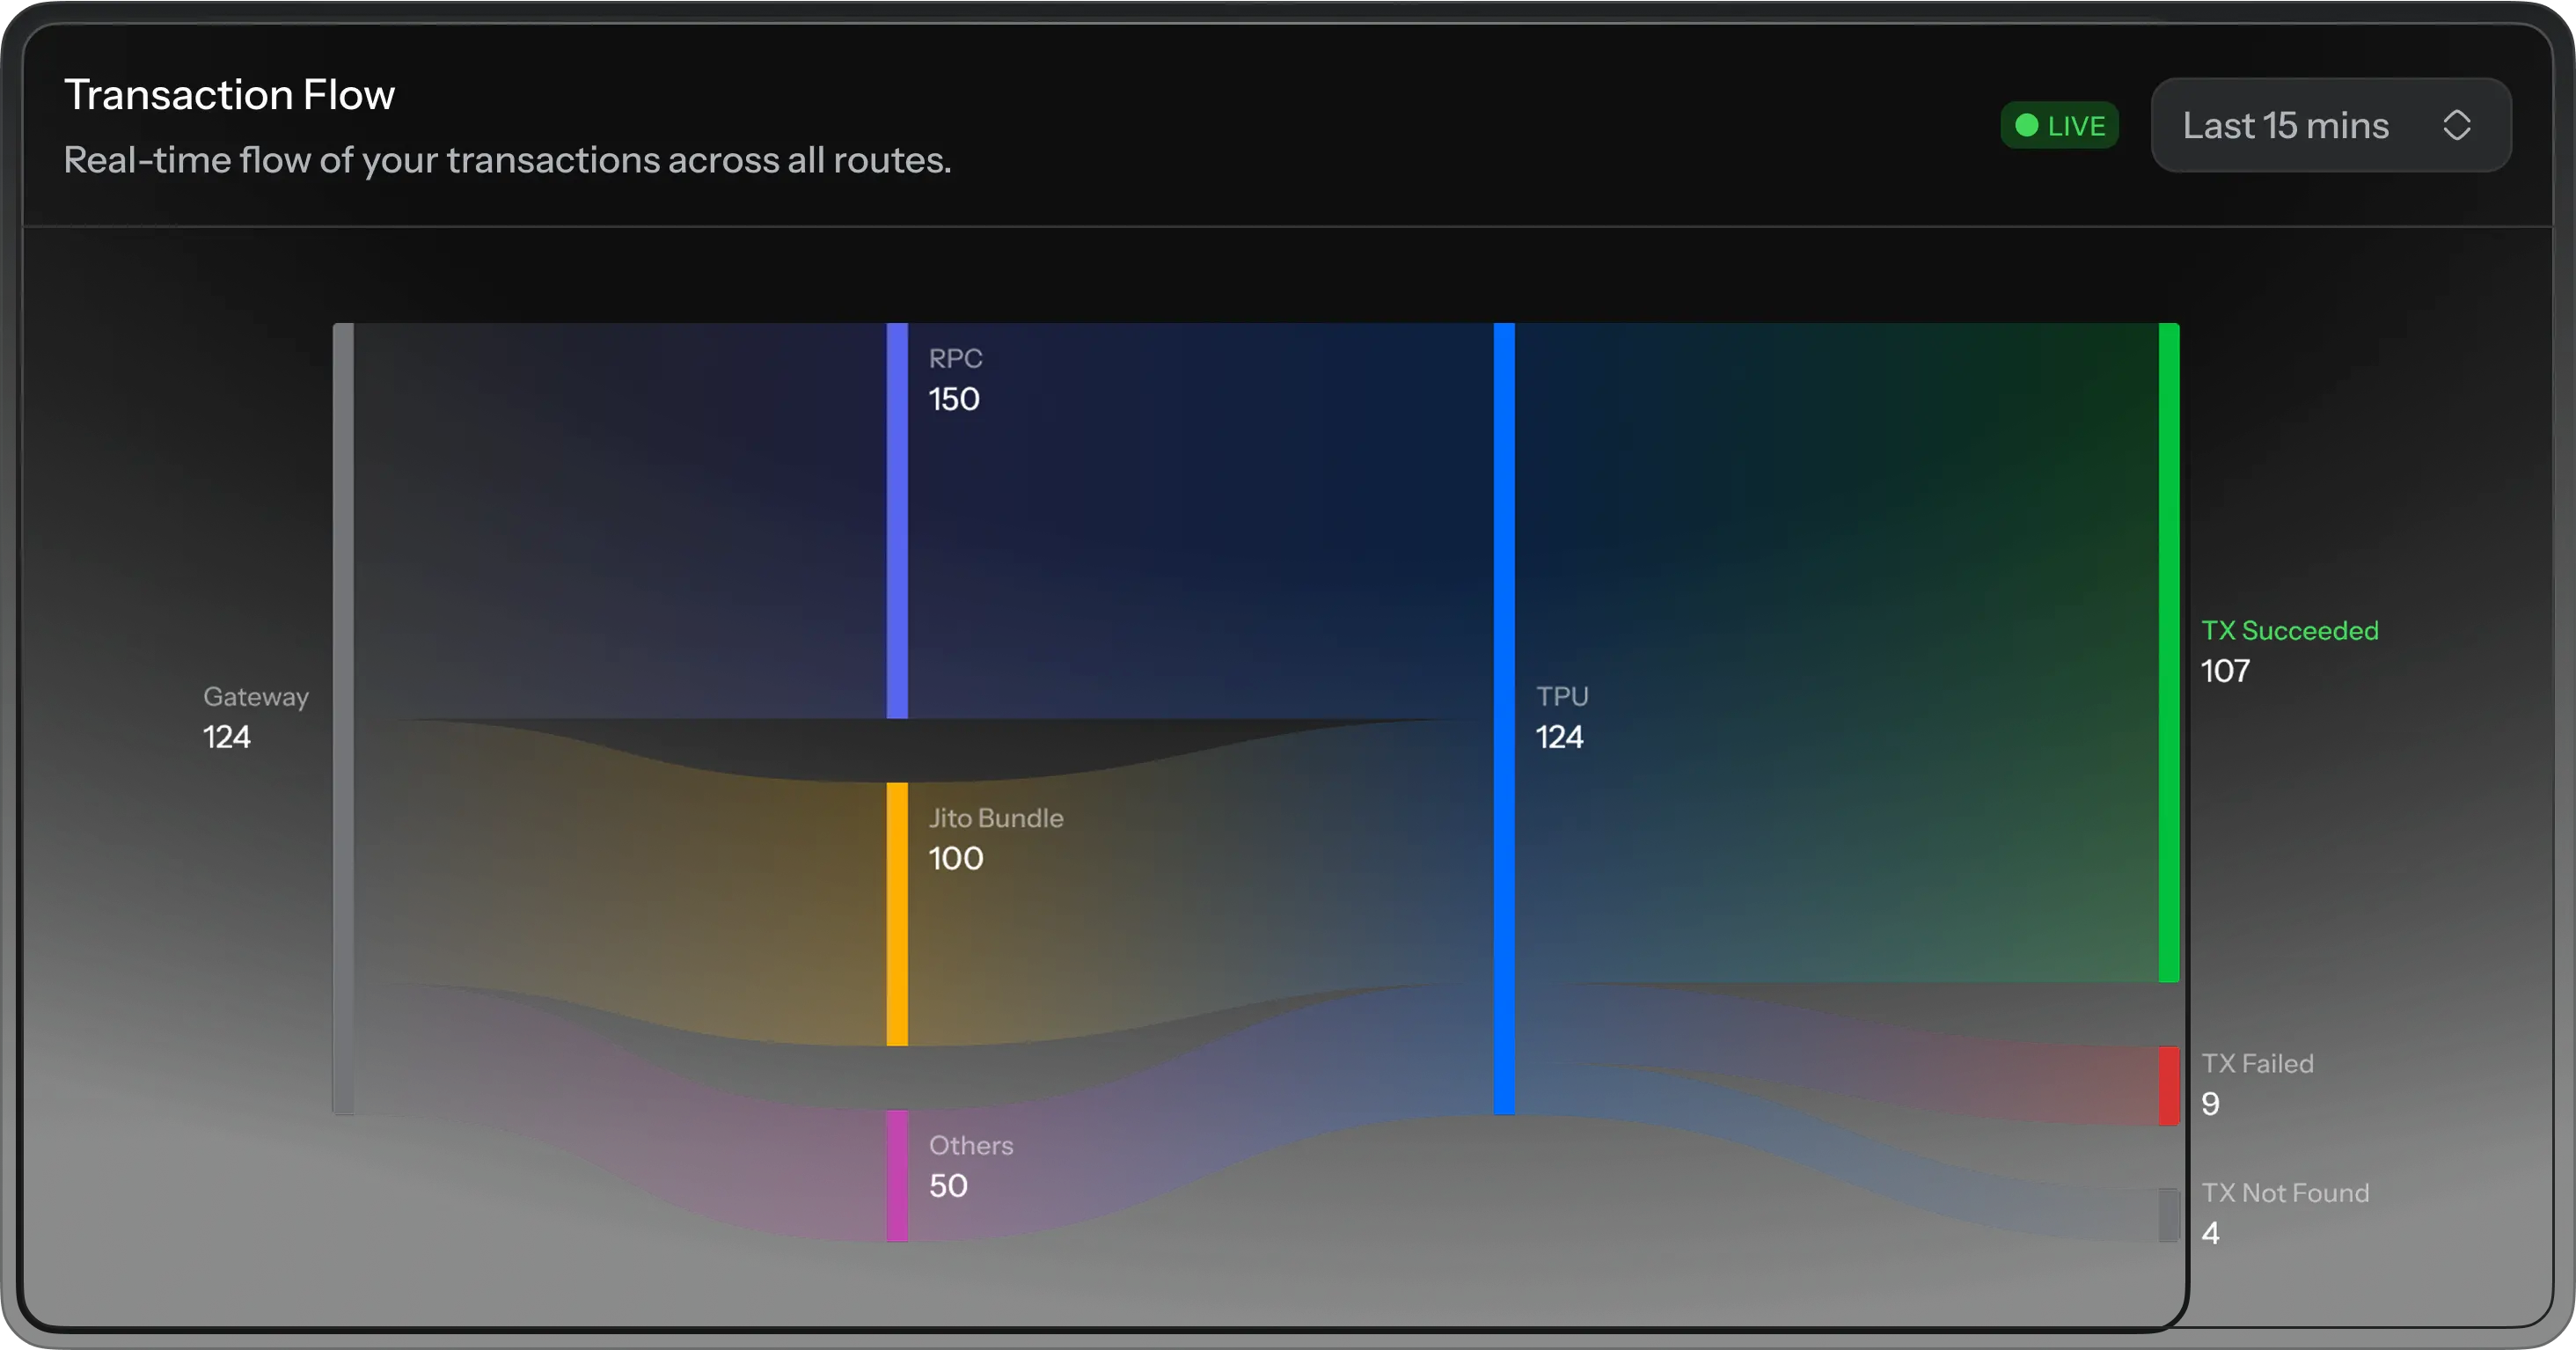
- Delivery Type: The time series chart of the delivery methods being used
- Slot Latency: The time series chart of the slot latency of transactions
What should I do if my landing rates are down?
In an event of high usage, the network can be congested and transactions can be difficult to land. In this scenario, you can do the following to improve reliability of your project:- Increase the priority fee and/or the Jito Tip range
- Update delivery methods
- Check logs for more details on the failed transactions